Aligning Cells
The relative coordinates and associated data of every Cell object can be transformed in order to spatially align and
overlap a set of measured cells. To do so, a cell with desired dimensions is generated first:
This model cell is used as a reference for alignment of a set of cells.
from colicoords import load, align_cells
cells = load('data/03_synthetic_cells.hdf5')
aligned = align_cells(model_cell, cells, r_norm=True, sigma=1)
The return value is a copy of model_cell where all aligned data elements from cells has been added. When the boolean
r_norm keyword argument is set to True, the cells radial coordinate are normalized by using the current value of
r in their coordinate system.
To align image-based data elements (fluorescence, brightfield) all pixel coordinates of all images are transformed to the
model cell’s coordinate system. The resulting point cloud is then convoluted with a gaussian kernel where the size of the
kernel is determined by the sigma parameter.
Localization-based data elements (storm) are aligned by transforming all localization parameters to the model cell’s coordinate system and then combining all localizations in one data element.
Data elements can be aligned individually by using the function align_data_element.
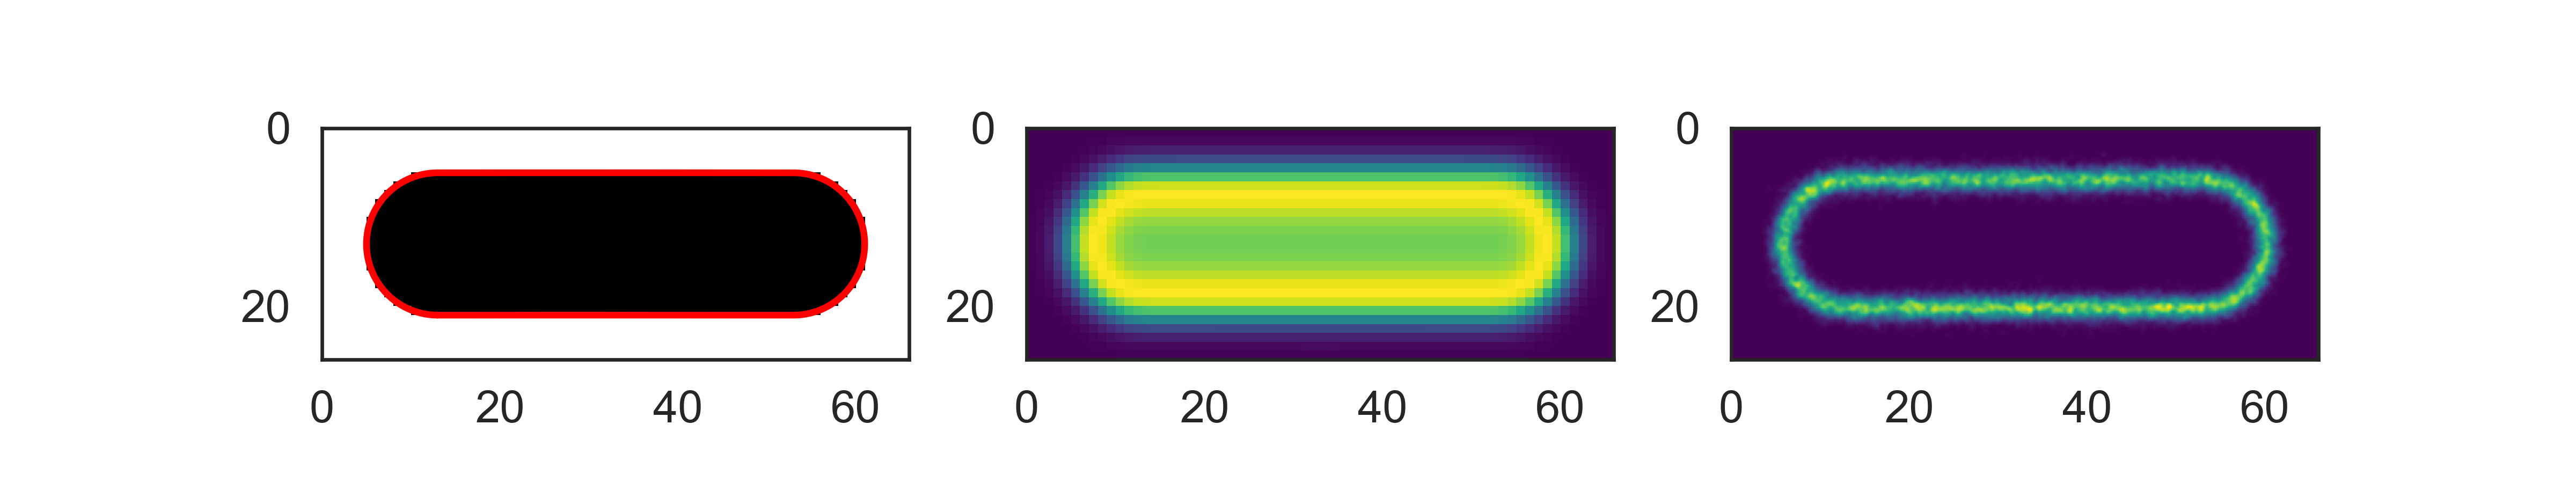
The final result of the alignment of this dataset can be visualized by:
from colicoords import CellPlot
cp = CellPlot(aligned_cell)
fig, axes = plt.subplots(1, 3, figsize=(8, 1.5))
cp.imshow('binary', ax=axes[0])
cp.plot_outline(ax=axes[0])
cp.imshow('fluorescence', ax=axes[1])
cp.plot_storm(method='gauss', ax=axes[2], upscale=10)
The above block of code takes about 10 minutes to render the STORM image on a typical CPU due to the large amount of localizations (>35k) and pixel upscale factor used.